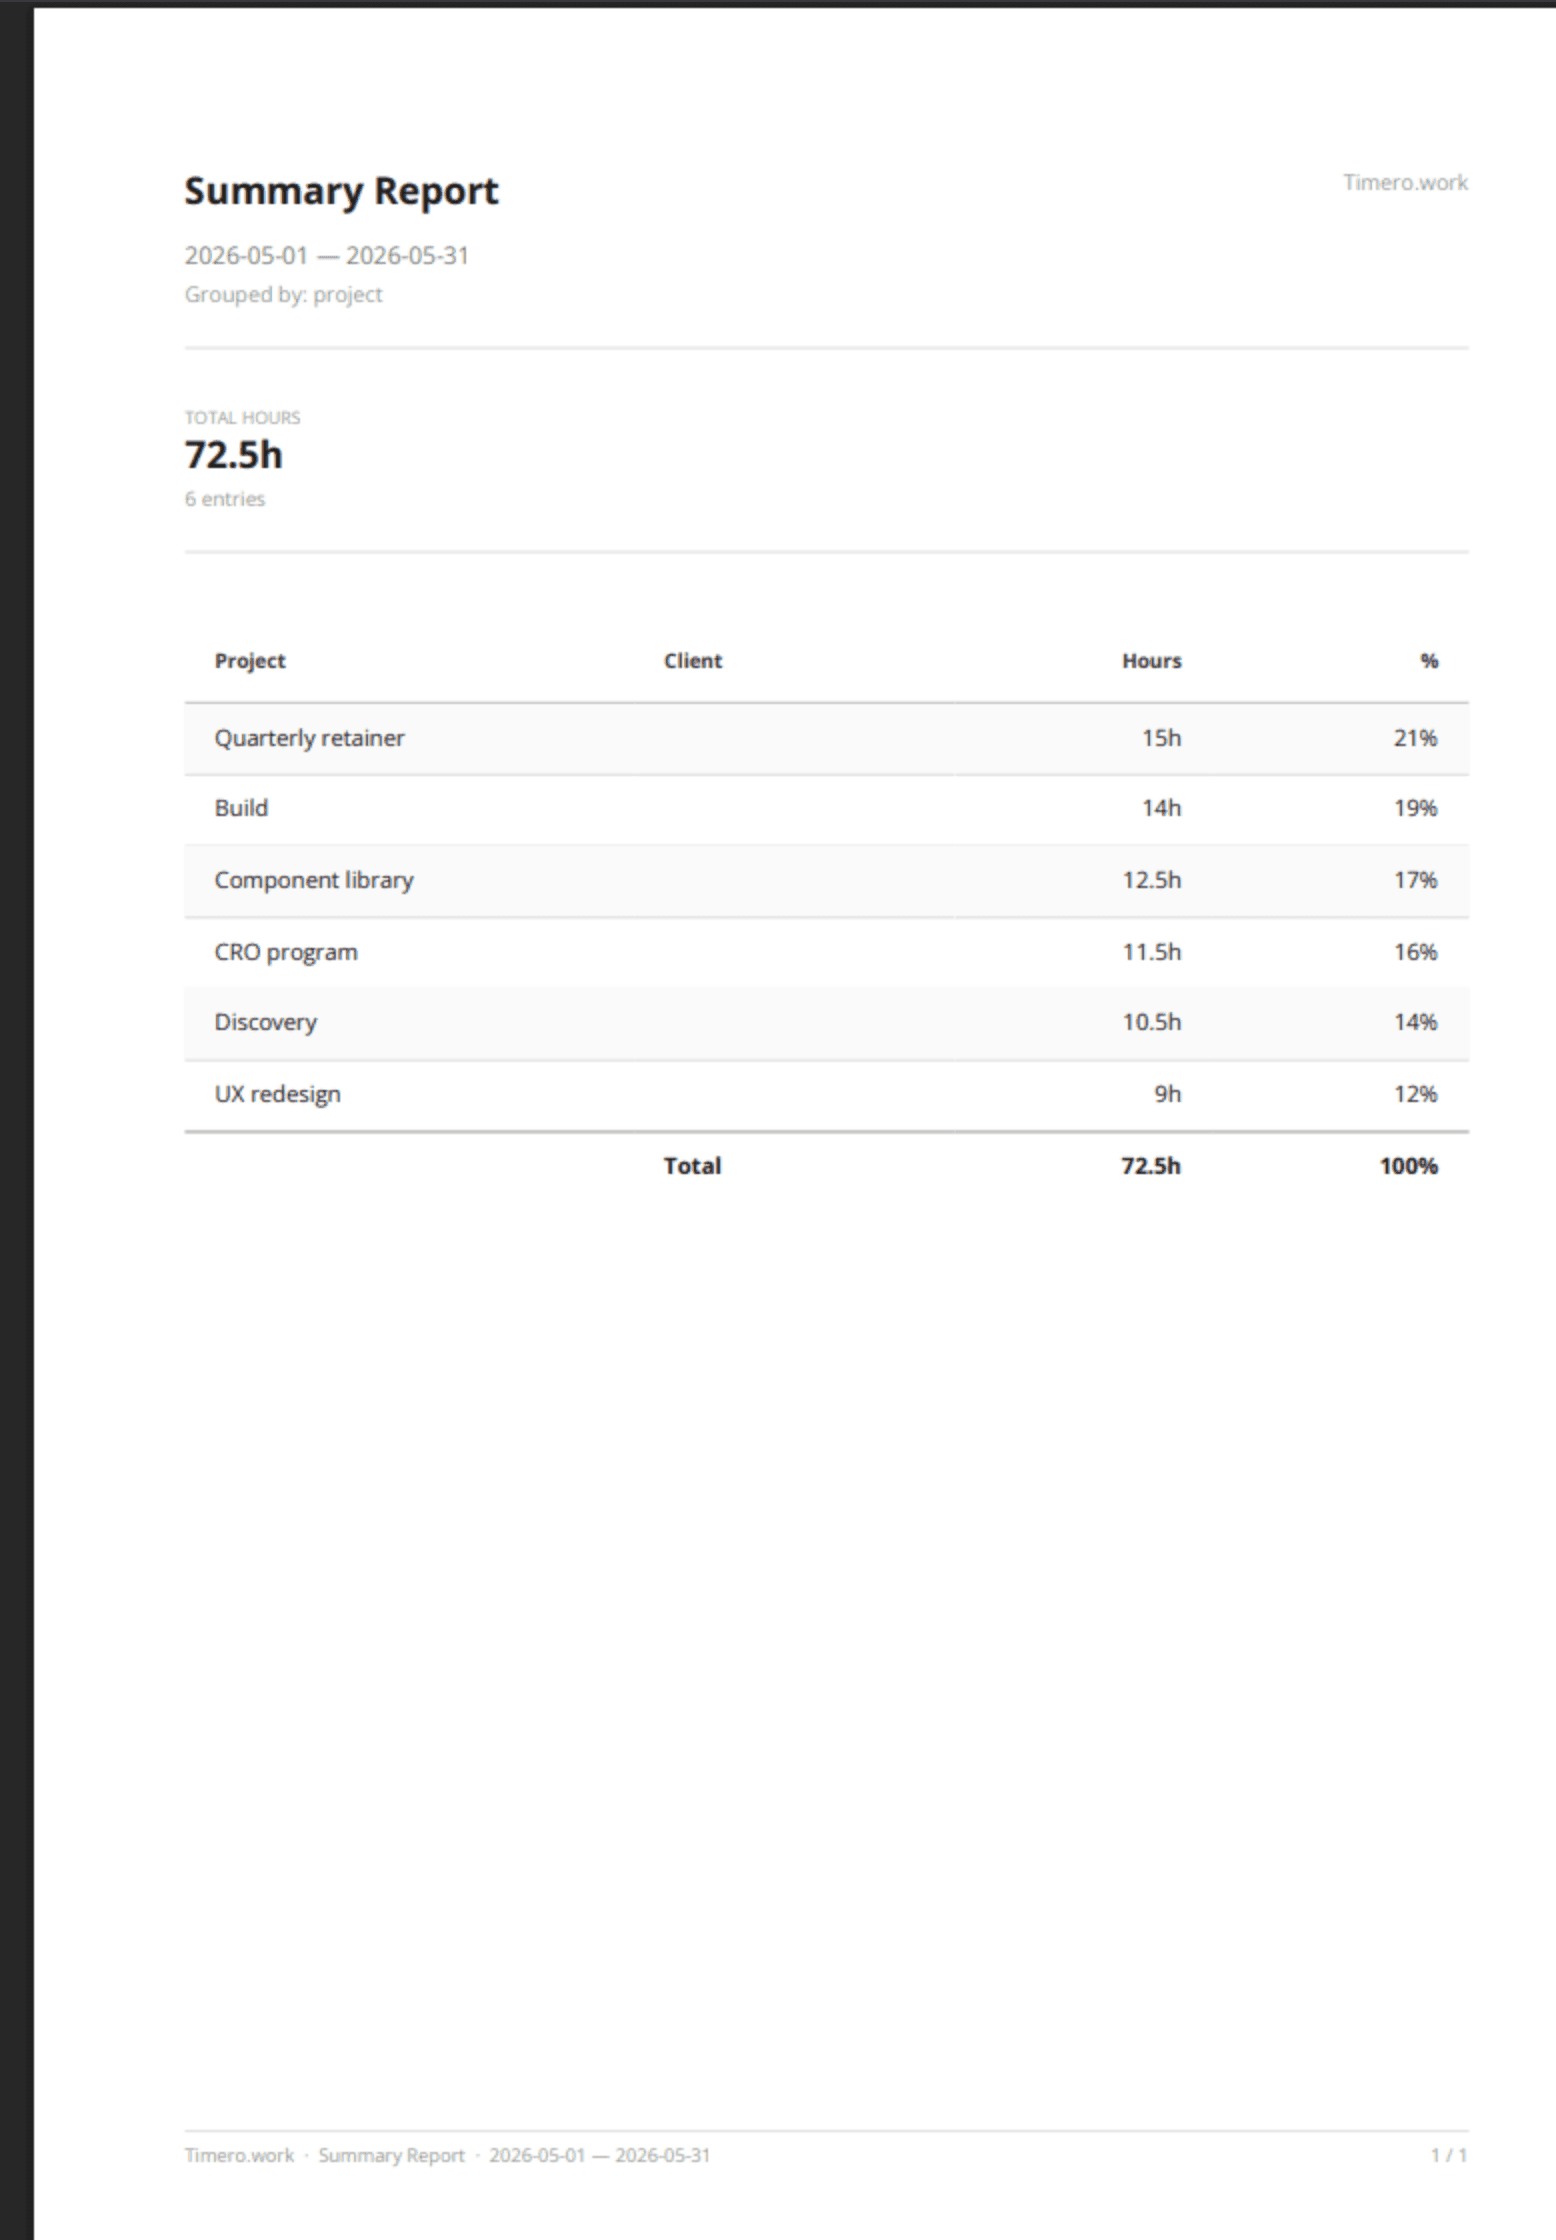
Hours log · Summary
Total hours grouped by project, with percentages.
A clean monthly summary. Filter by client, project, or member before exporting. One click from the Reports page.
Seven honest screenshots of Timero today. No vaporware, no roadmap stitching, no upsell hidden behind a paywall.
The calendar is the product. Drag empty space to log time. Click an entry to edit. Your week shows up as you actually worked it: billable blocks ready to ship to an invoice.
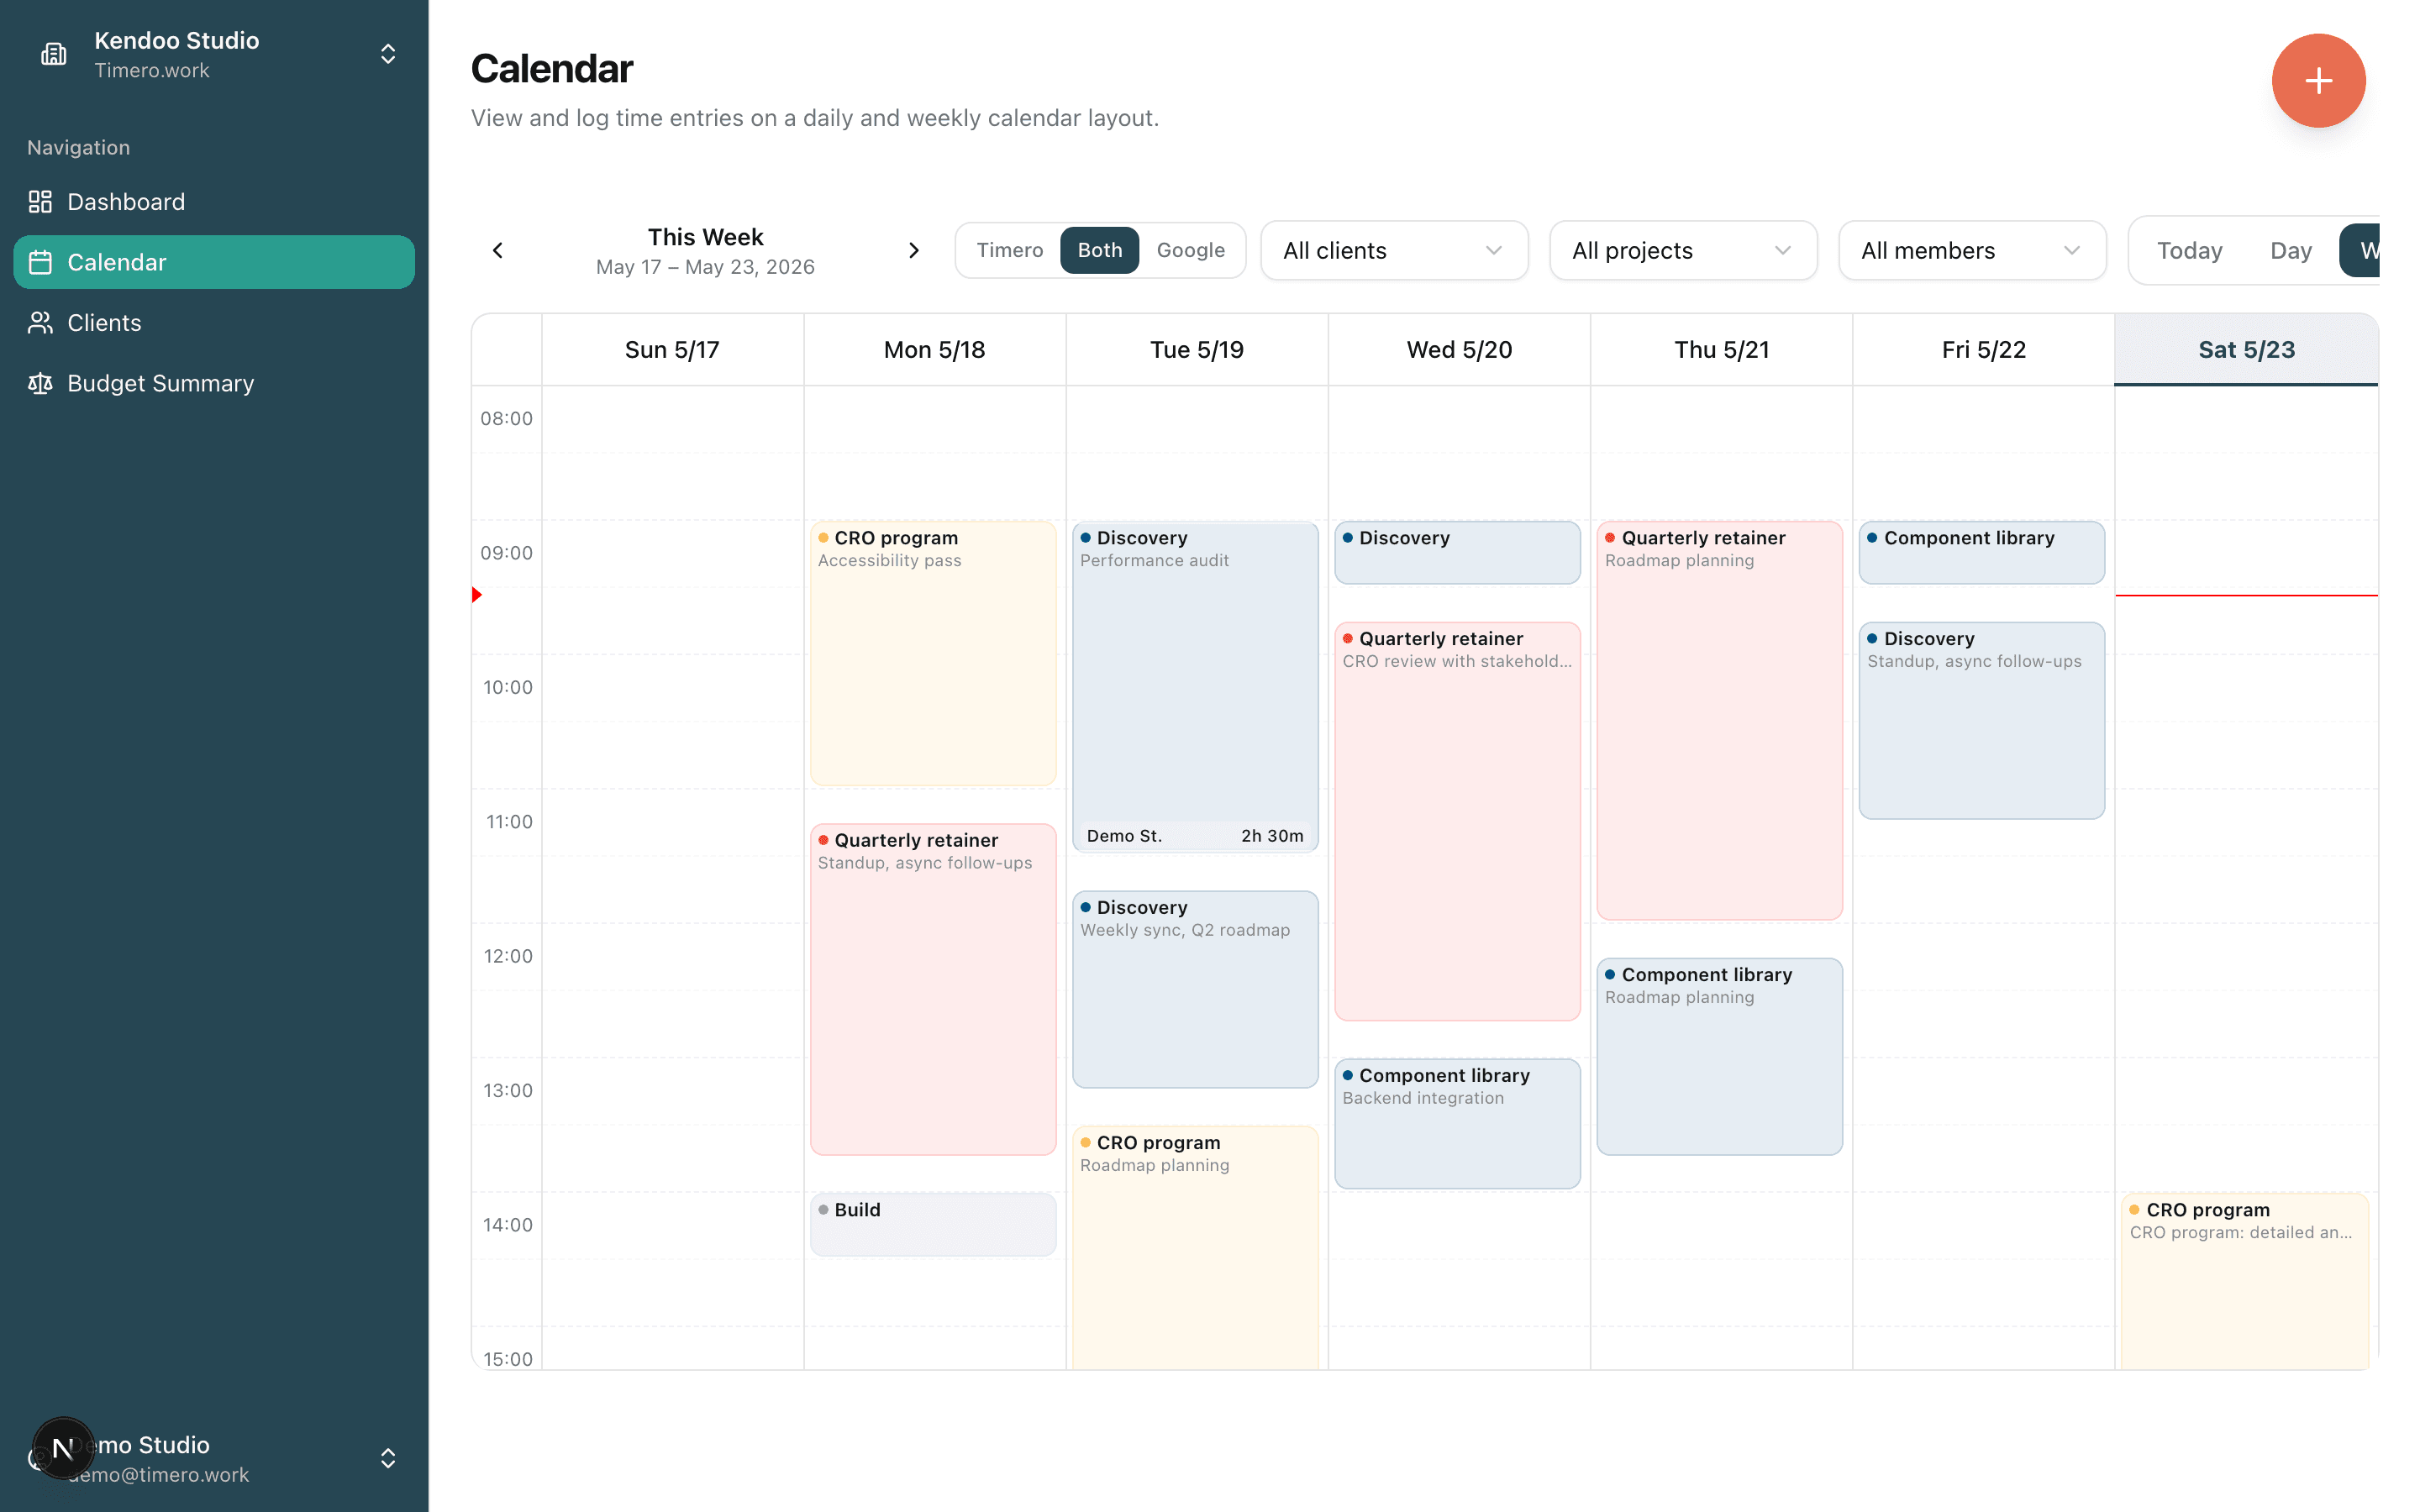
Check in from the + menu and a live timer runs in the corner, on desktop and mobile. Pick the project now or while the clock ticks. Check out and the session lands as a normal entry: on your calendar, in your reports, counted against the right budget. No stopwatch app, no copy-paste, no second tool.
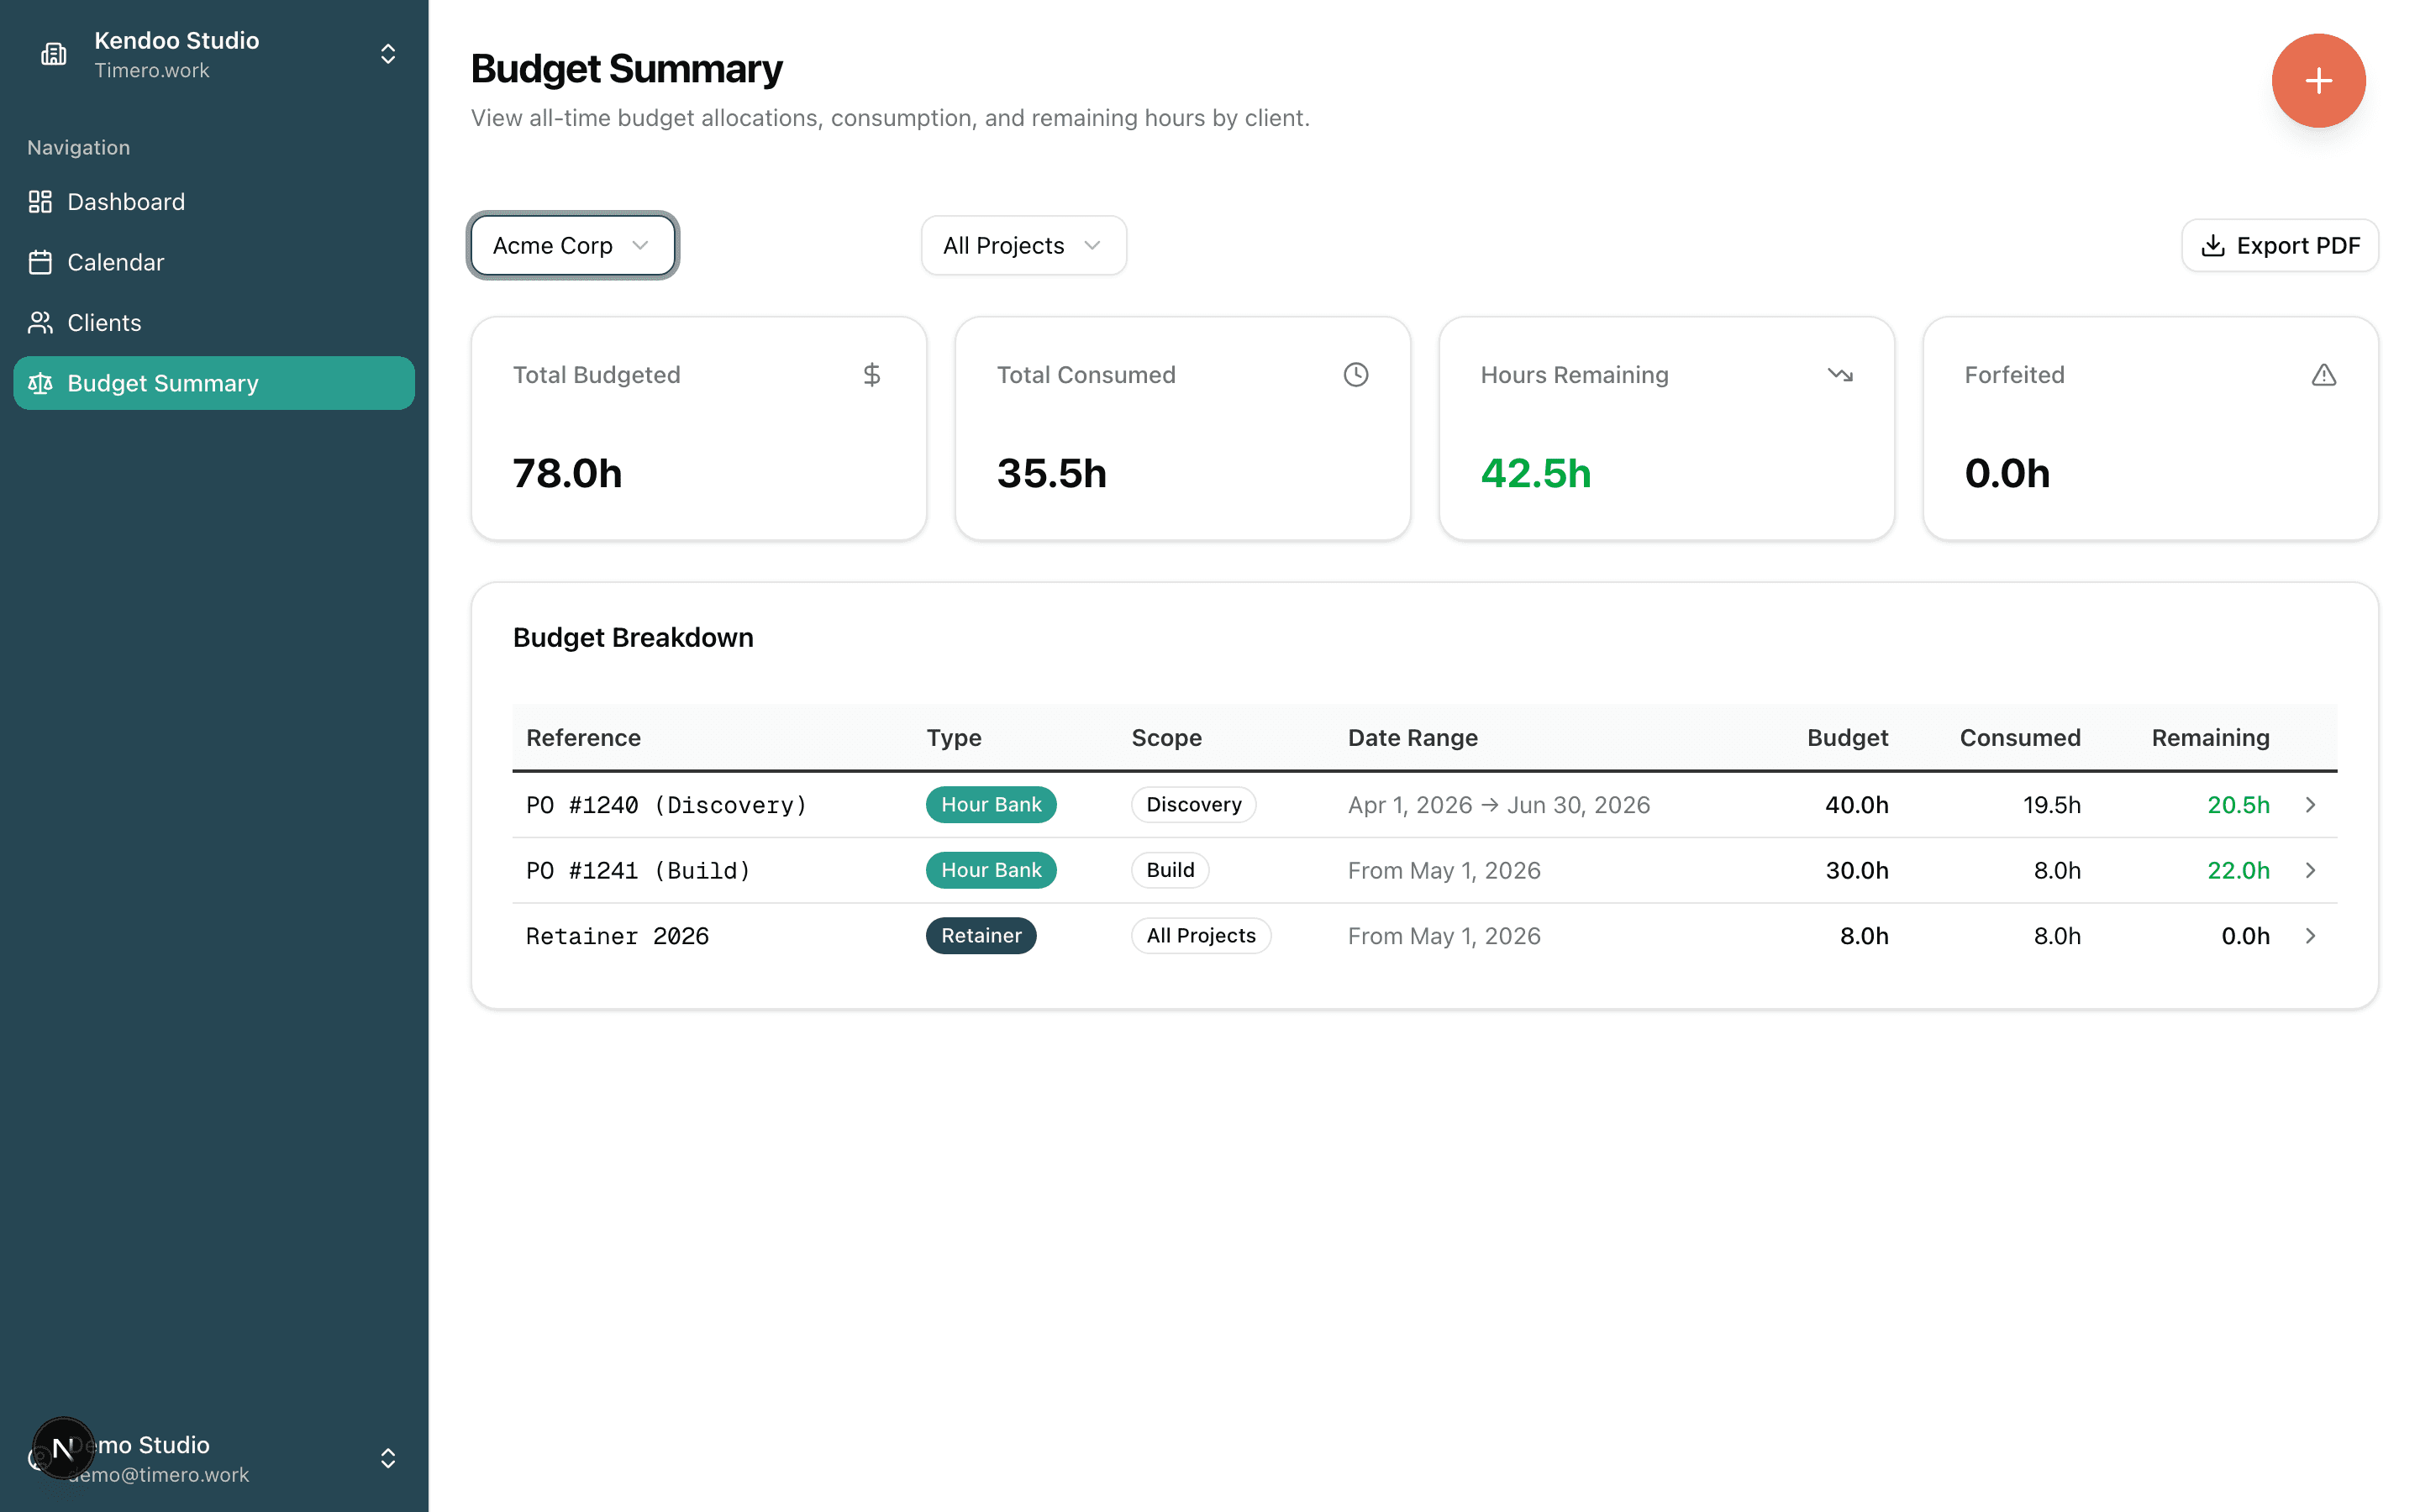
Real engagements have a purchase order per project plus a monthly retainer over the top. Most trackers force a single budget per client. Timero lets you keep them separate, each with its own scope, expiry, and payment reference, then sums them together for the over-budget engine.
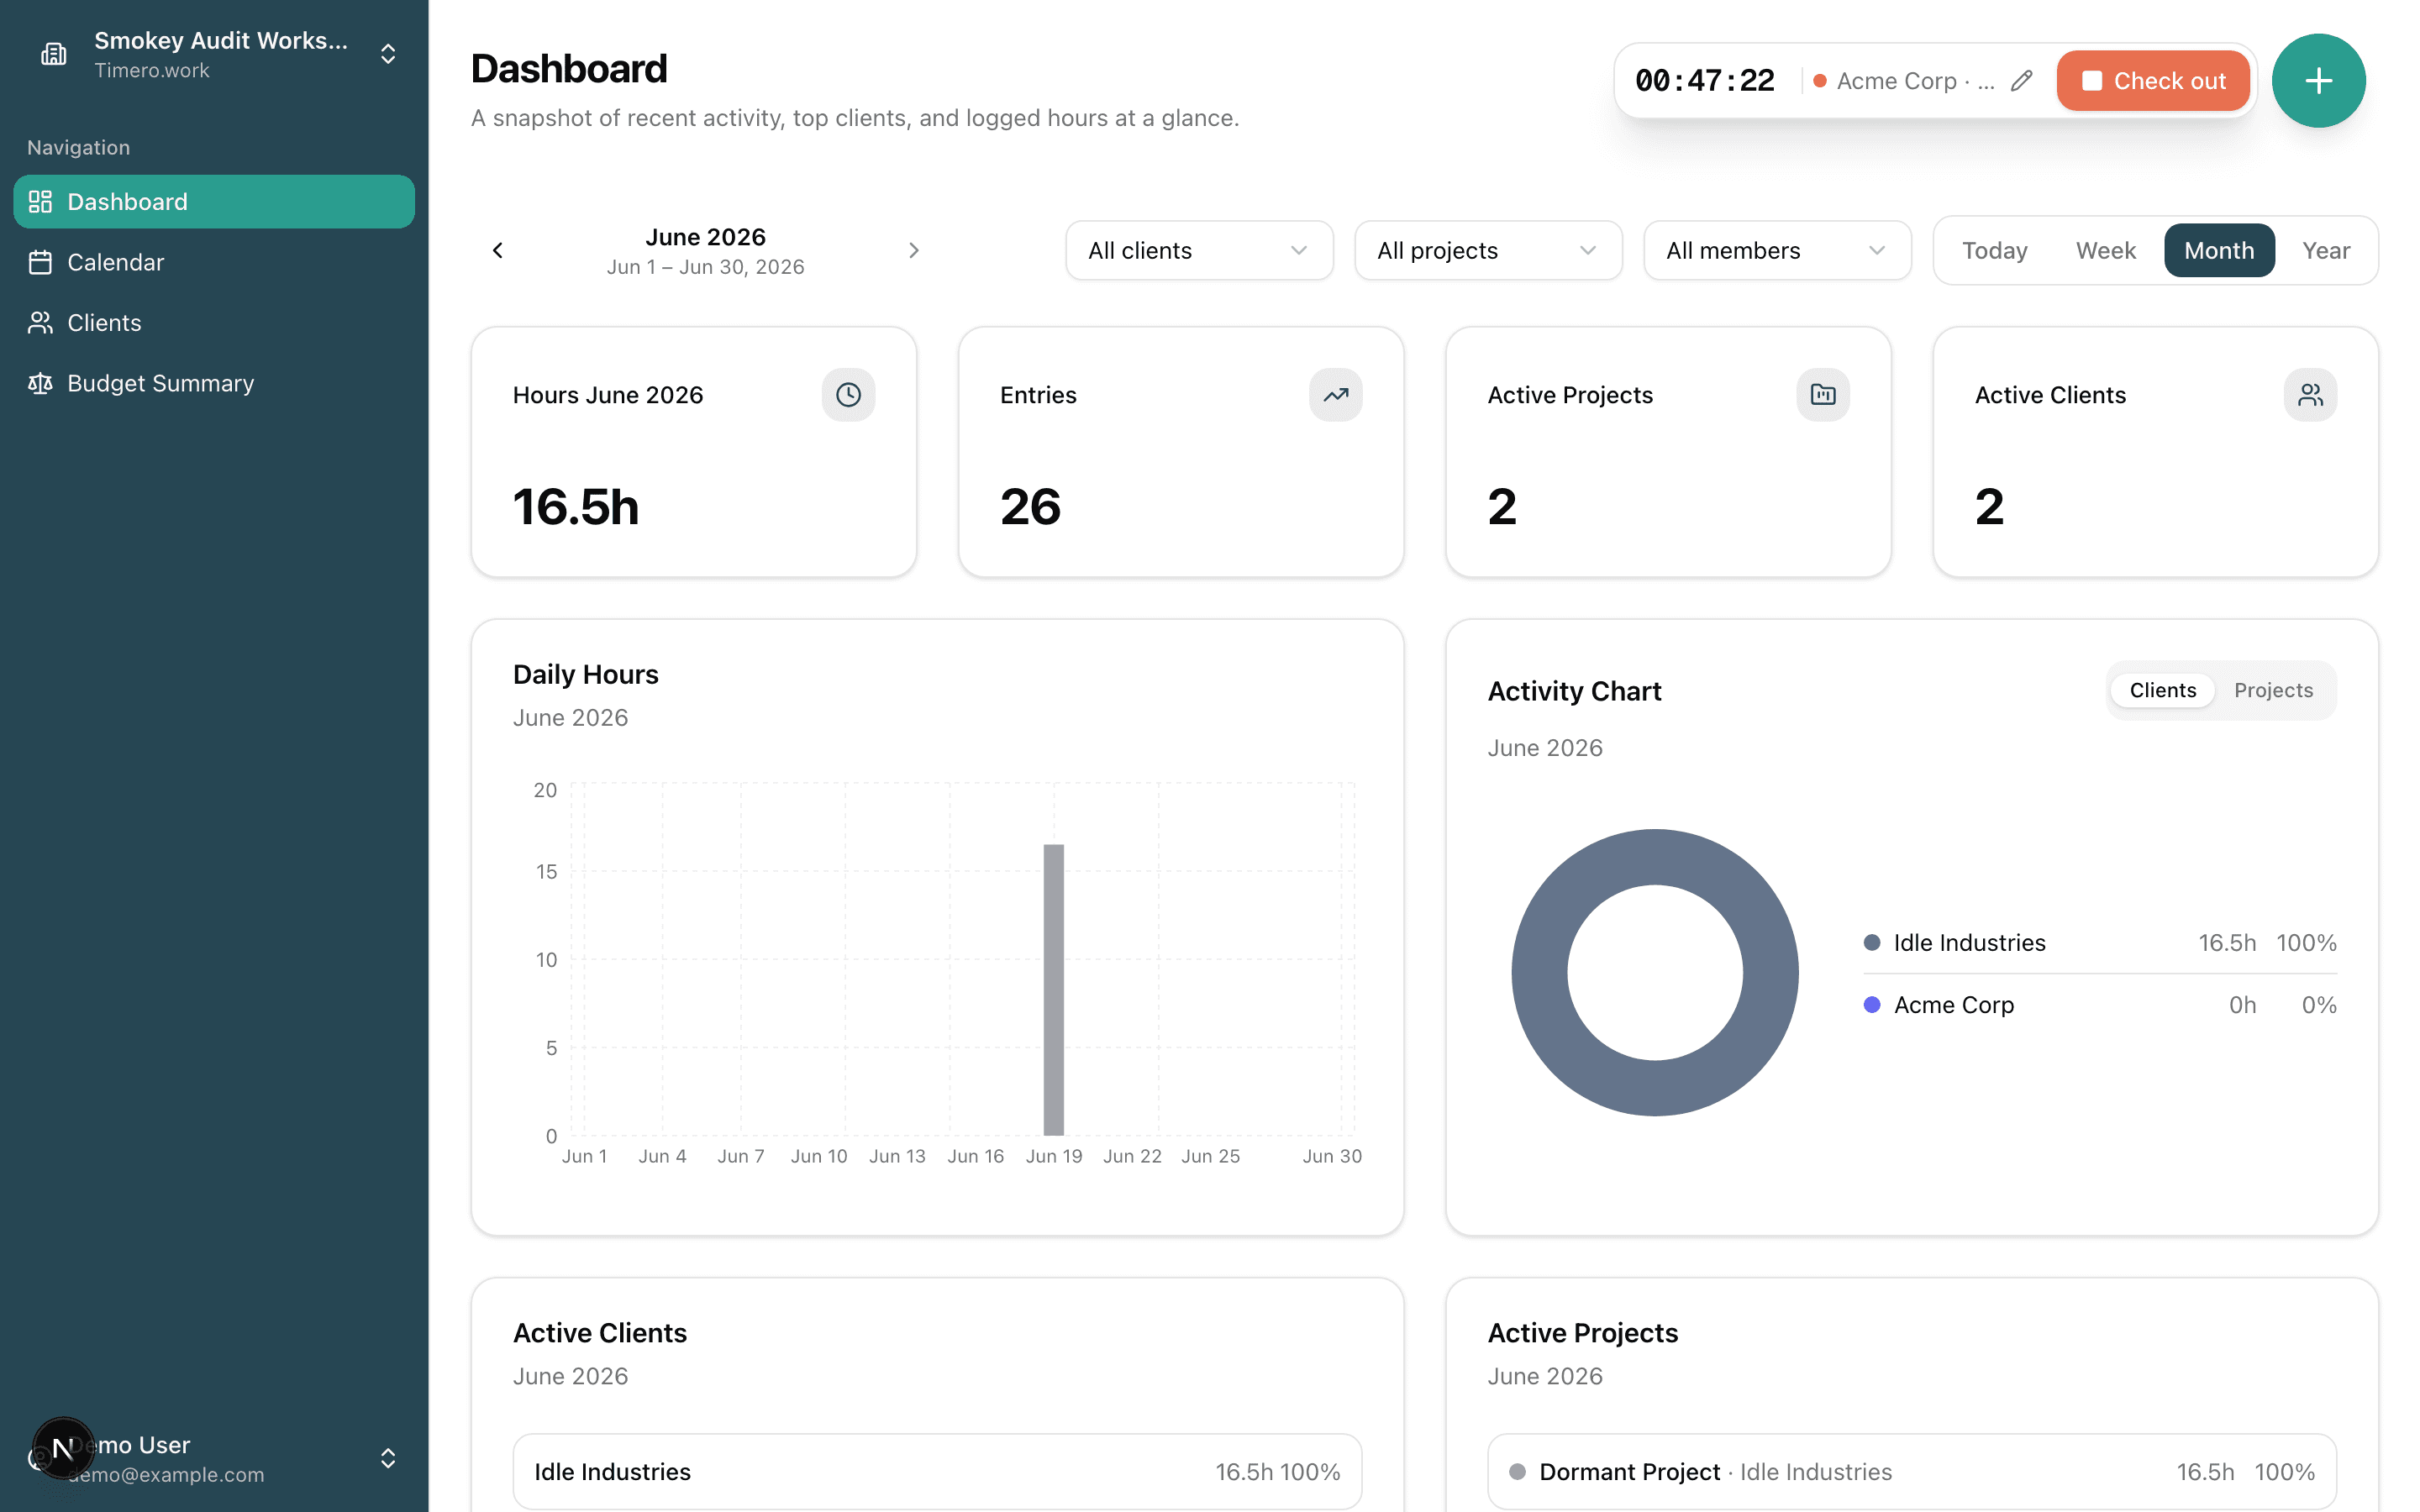
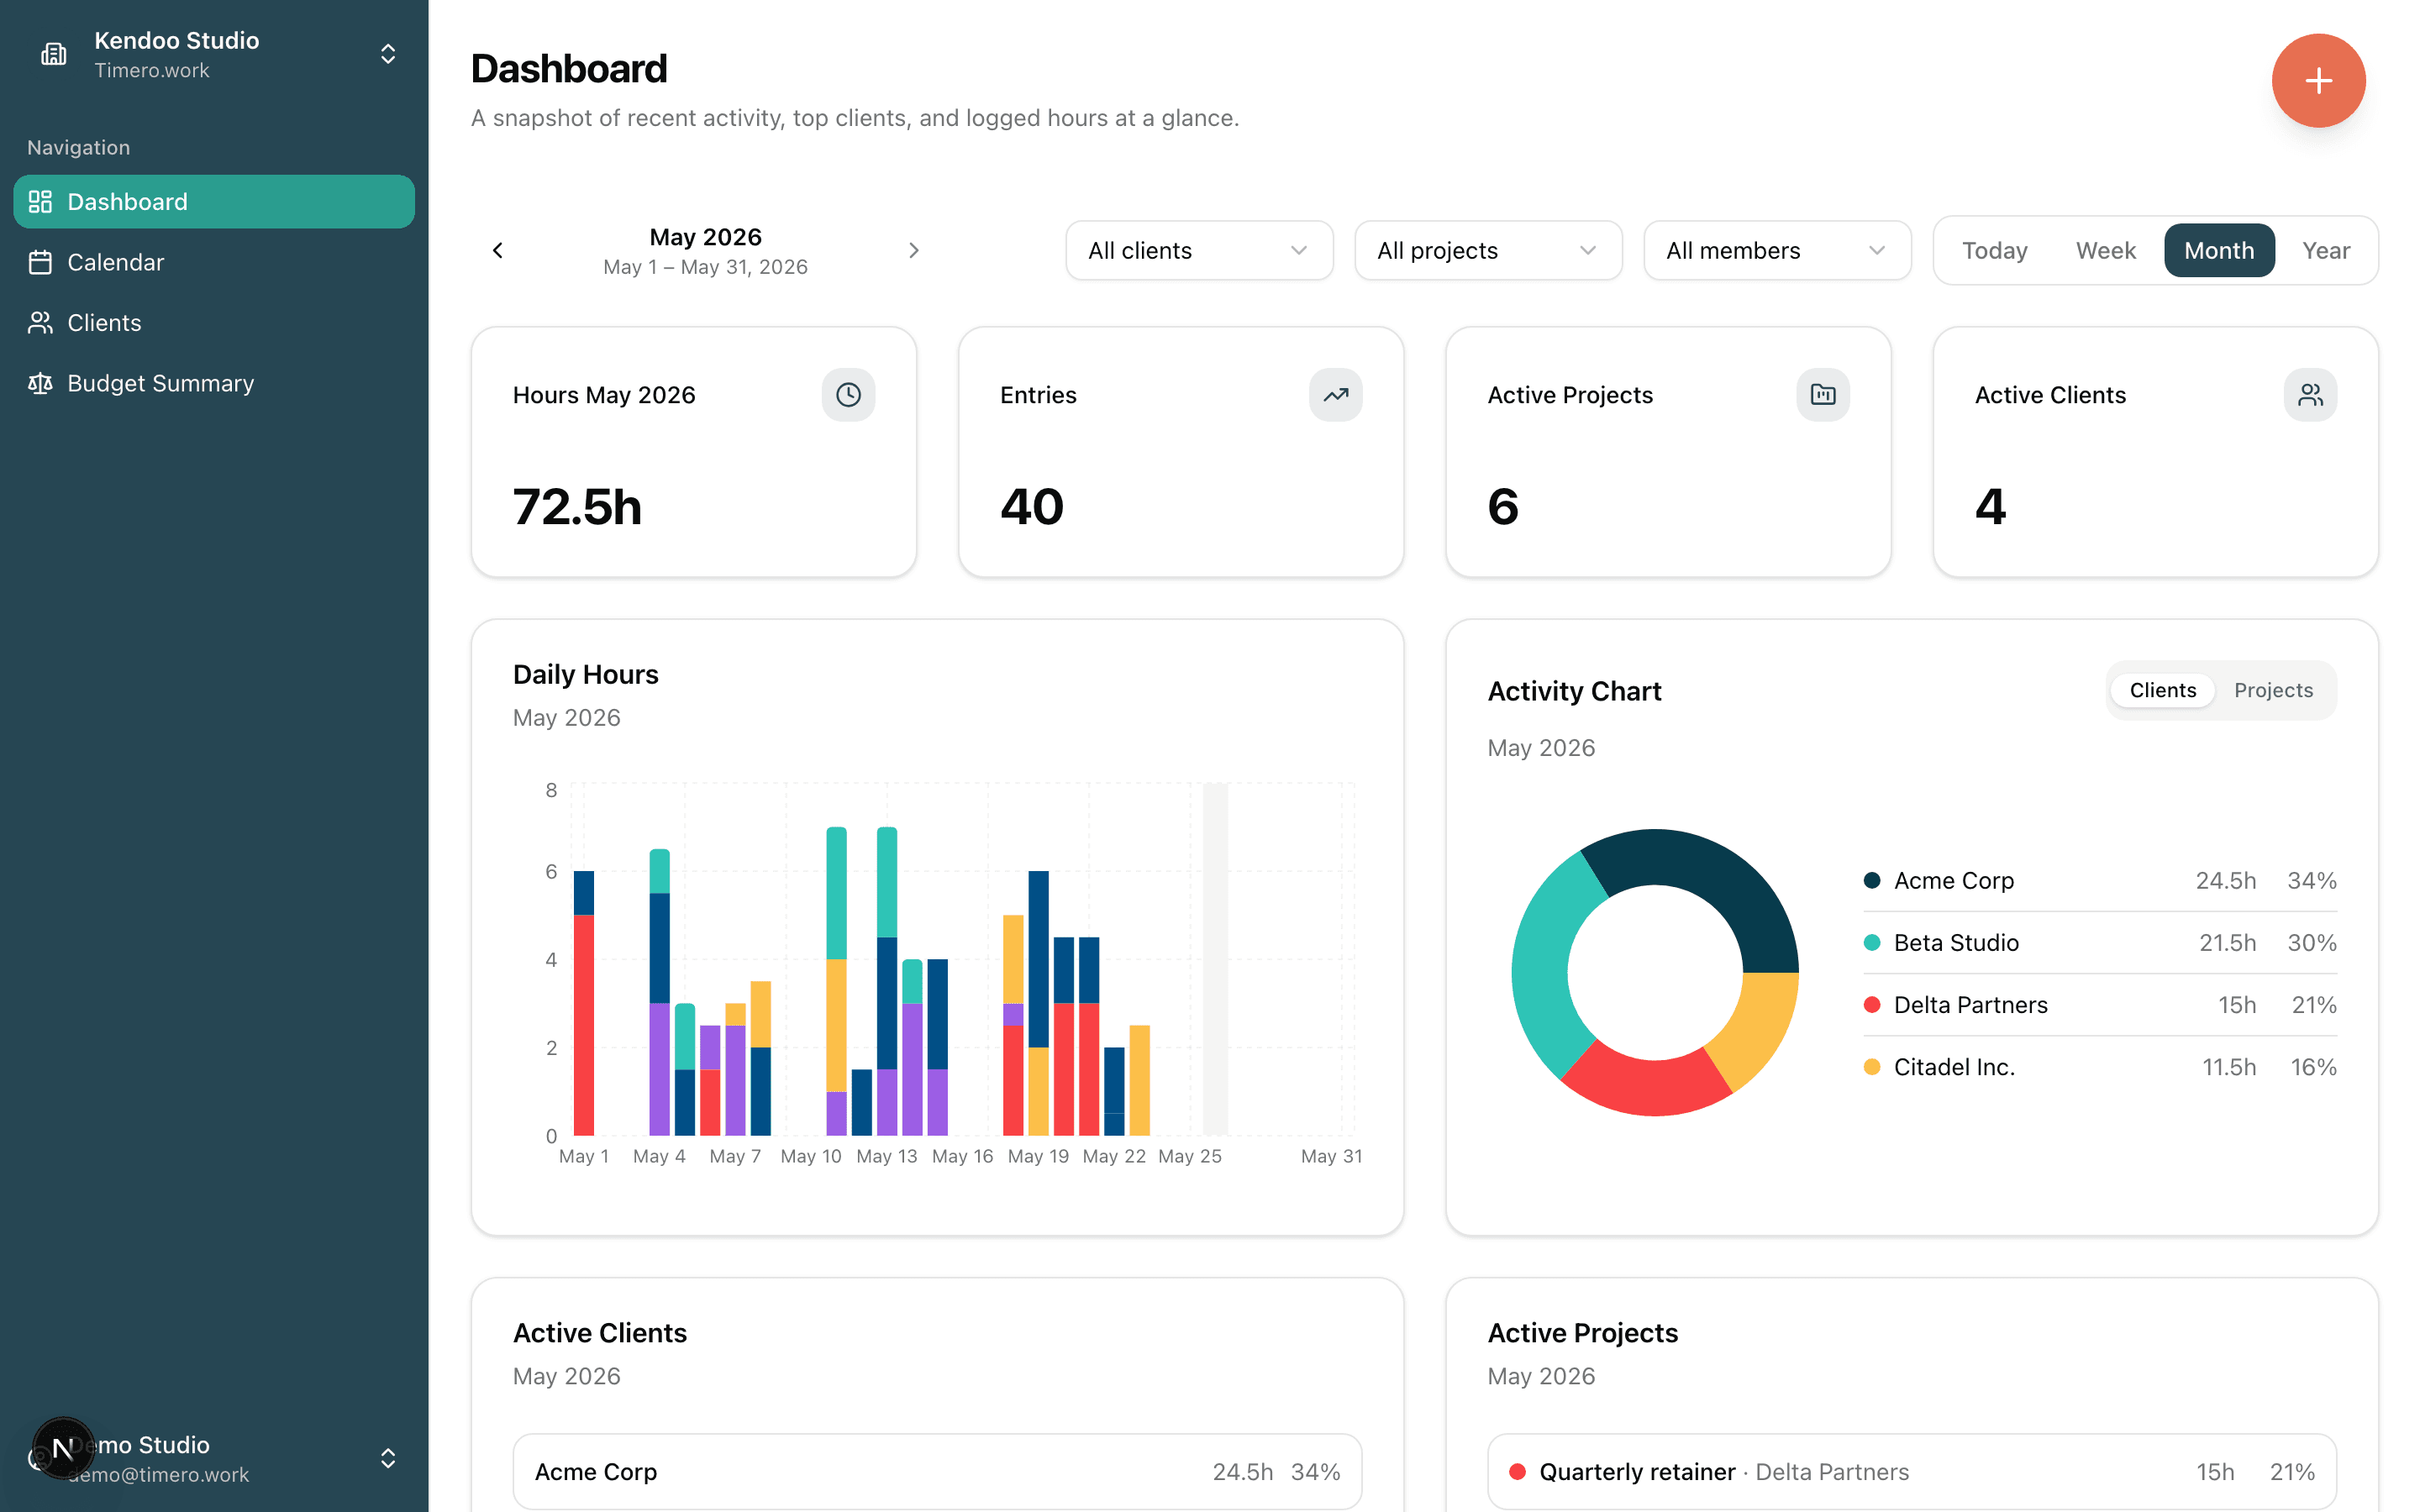
KPIs that update with every save. A daily-hours chart so you can spot the dip on Tuesday. A client breakdown that flags who's about to go over budget. All on one screen, before you've poured your second coffee.
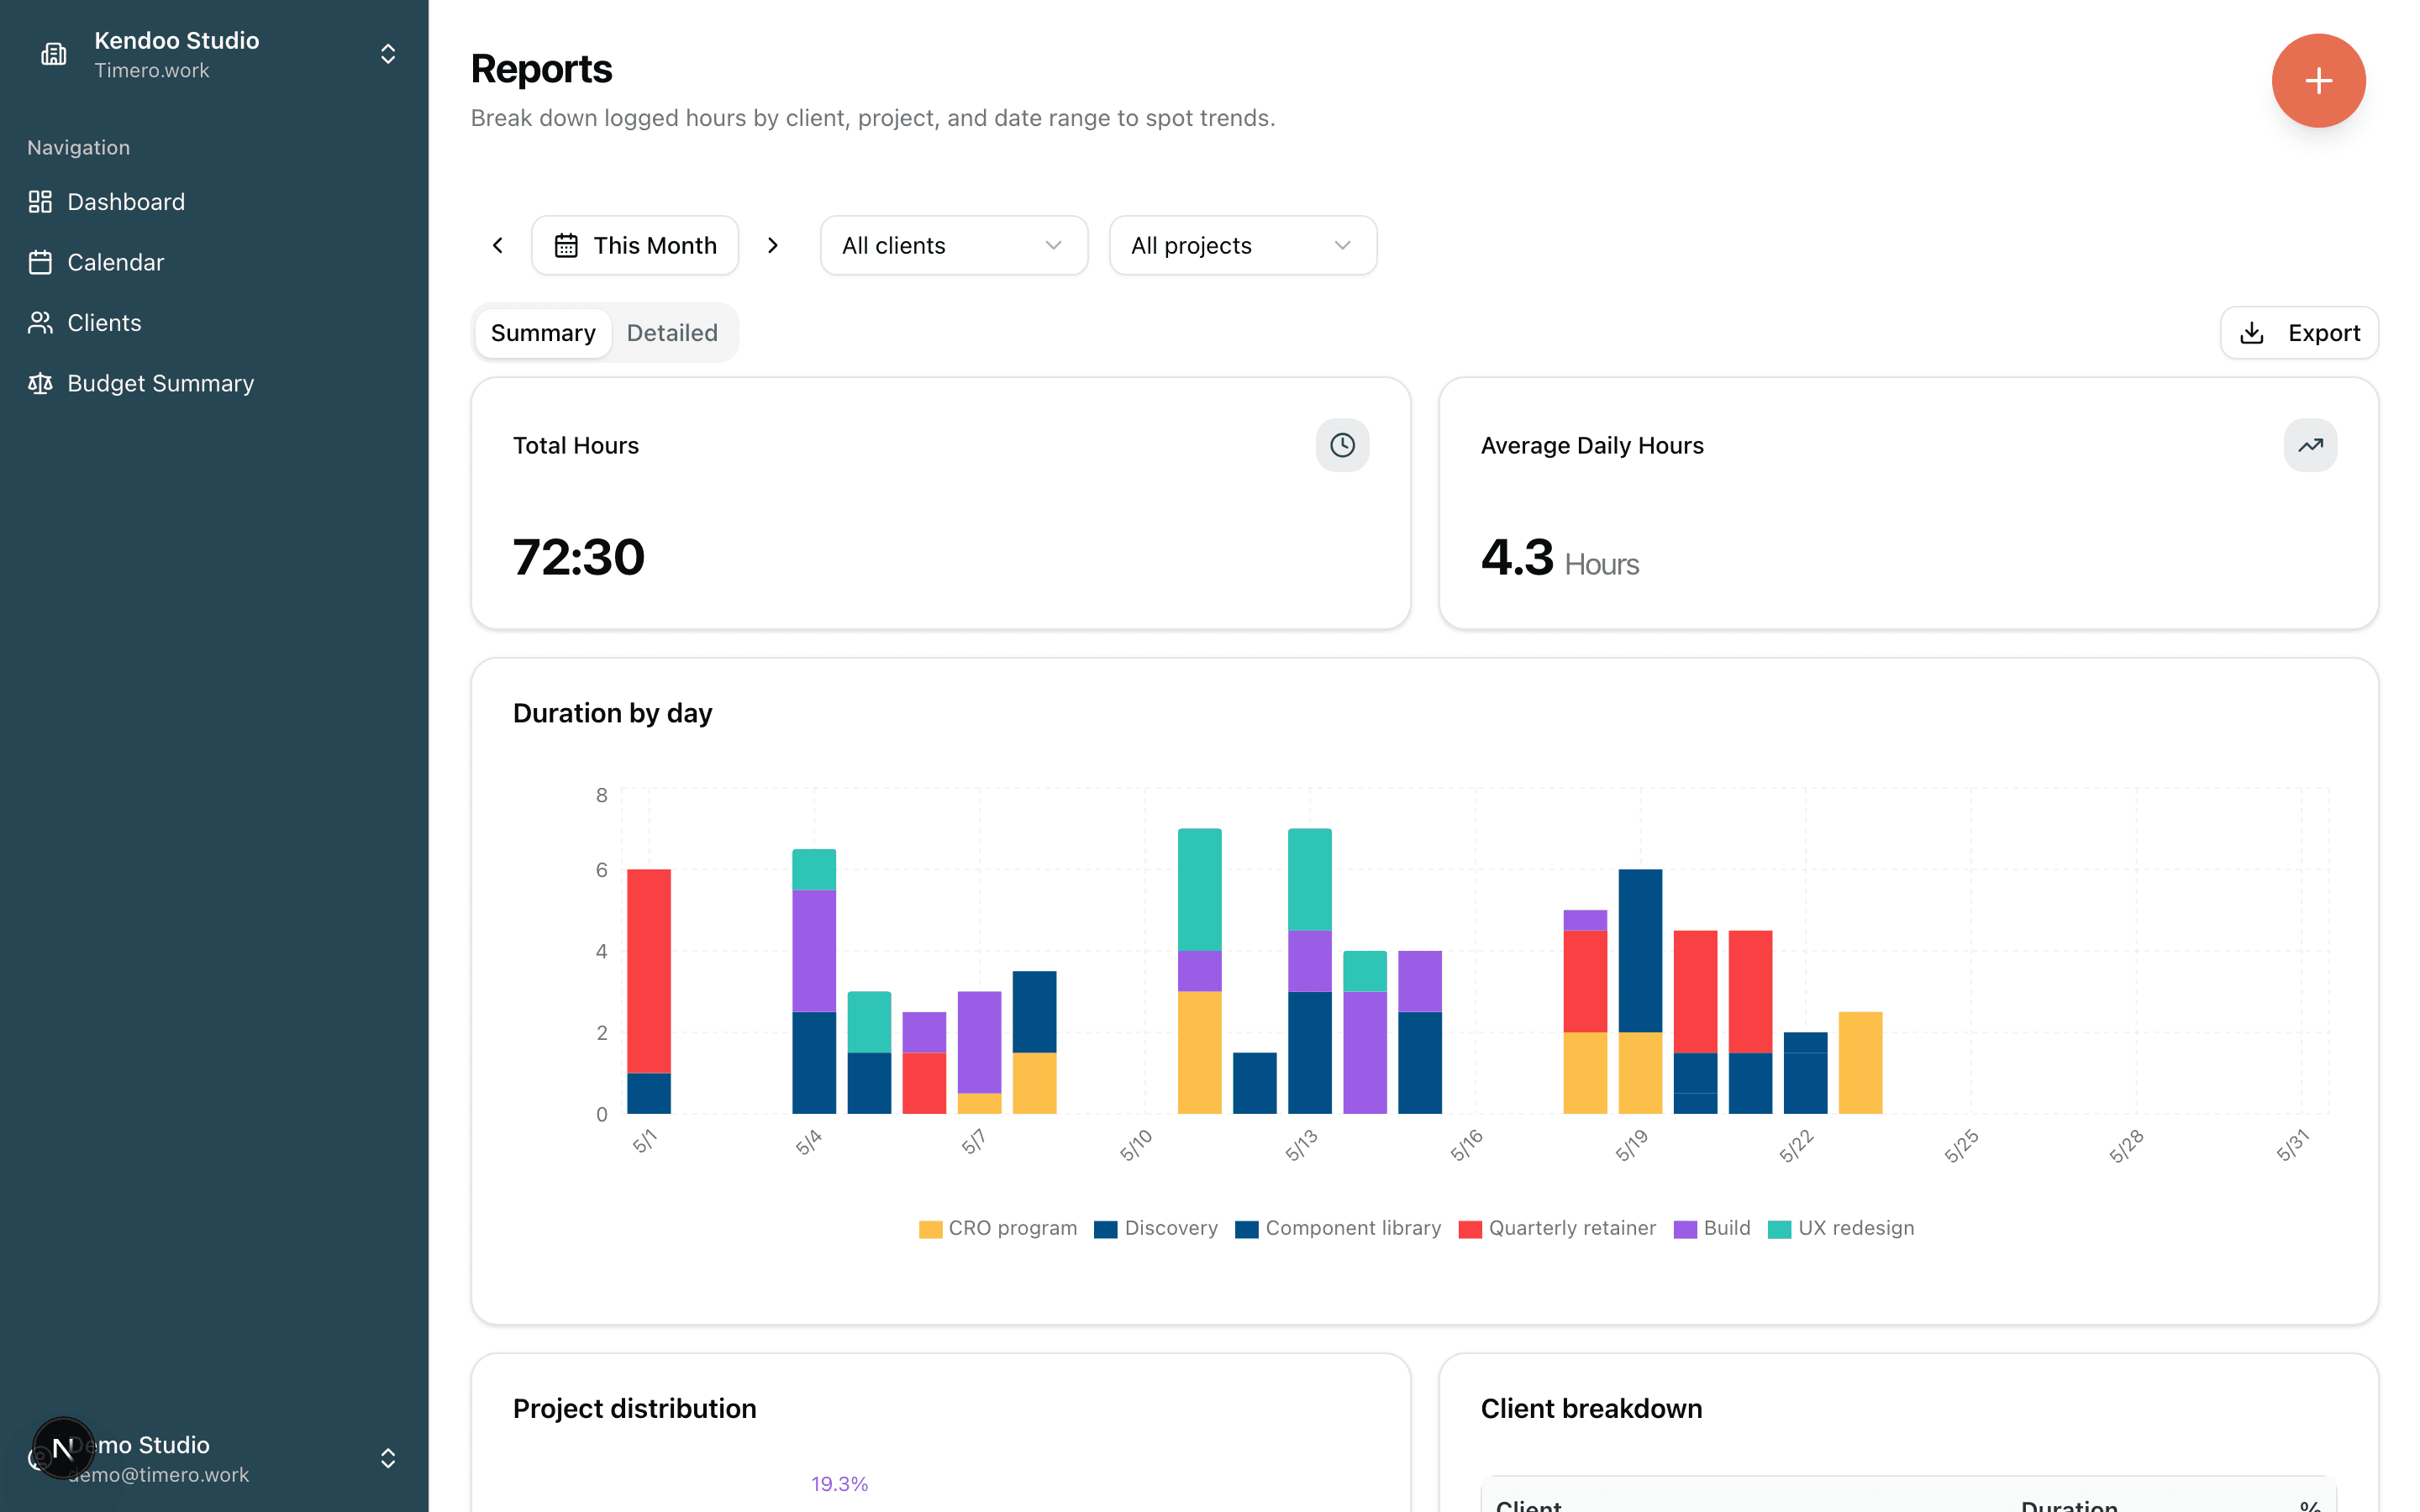
Filter by client, project, member, or any window of time. See the stacked bar chart and detailed totals. Hit Export and get a PDF or CSV designed for invoicing, not a generic spreadsheet dump.
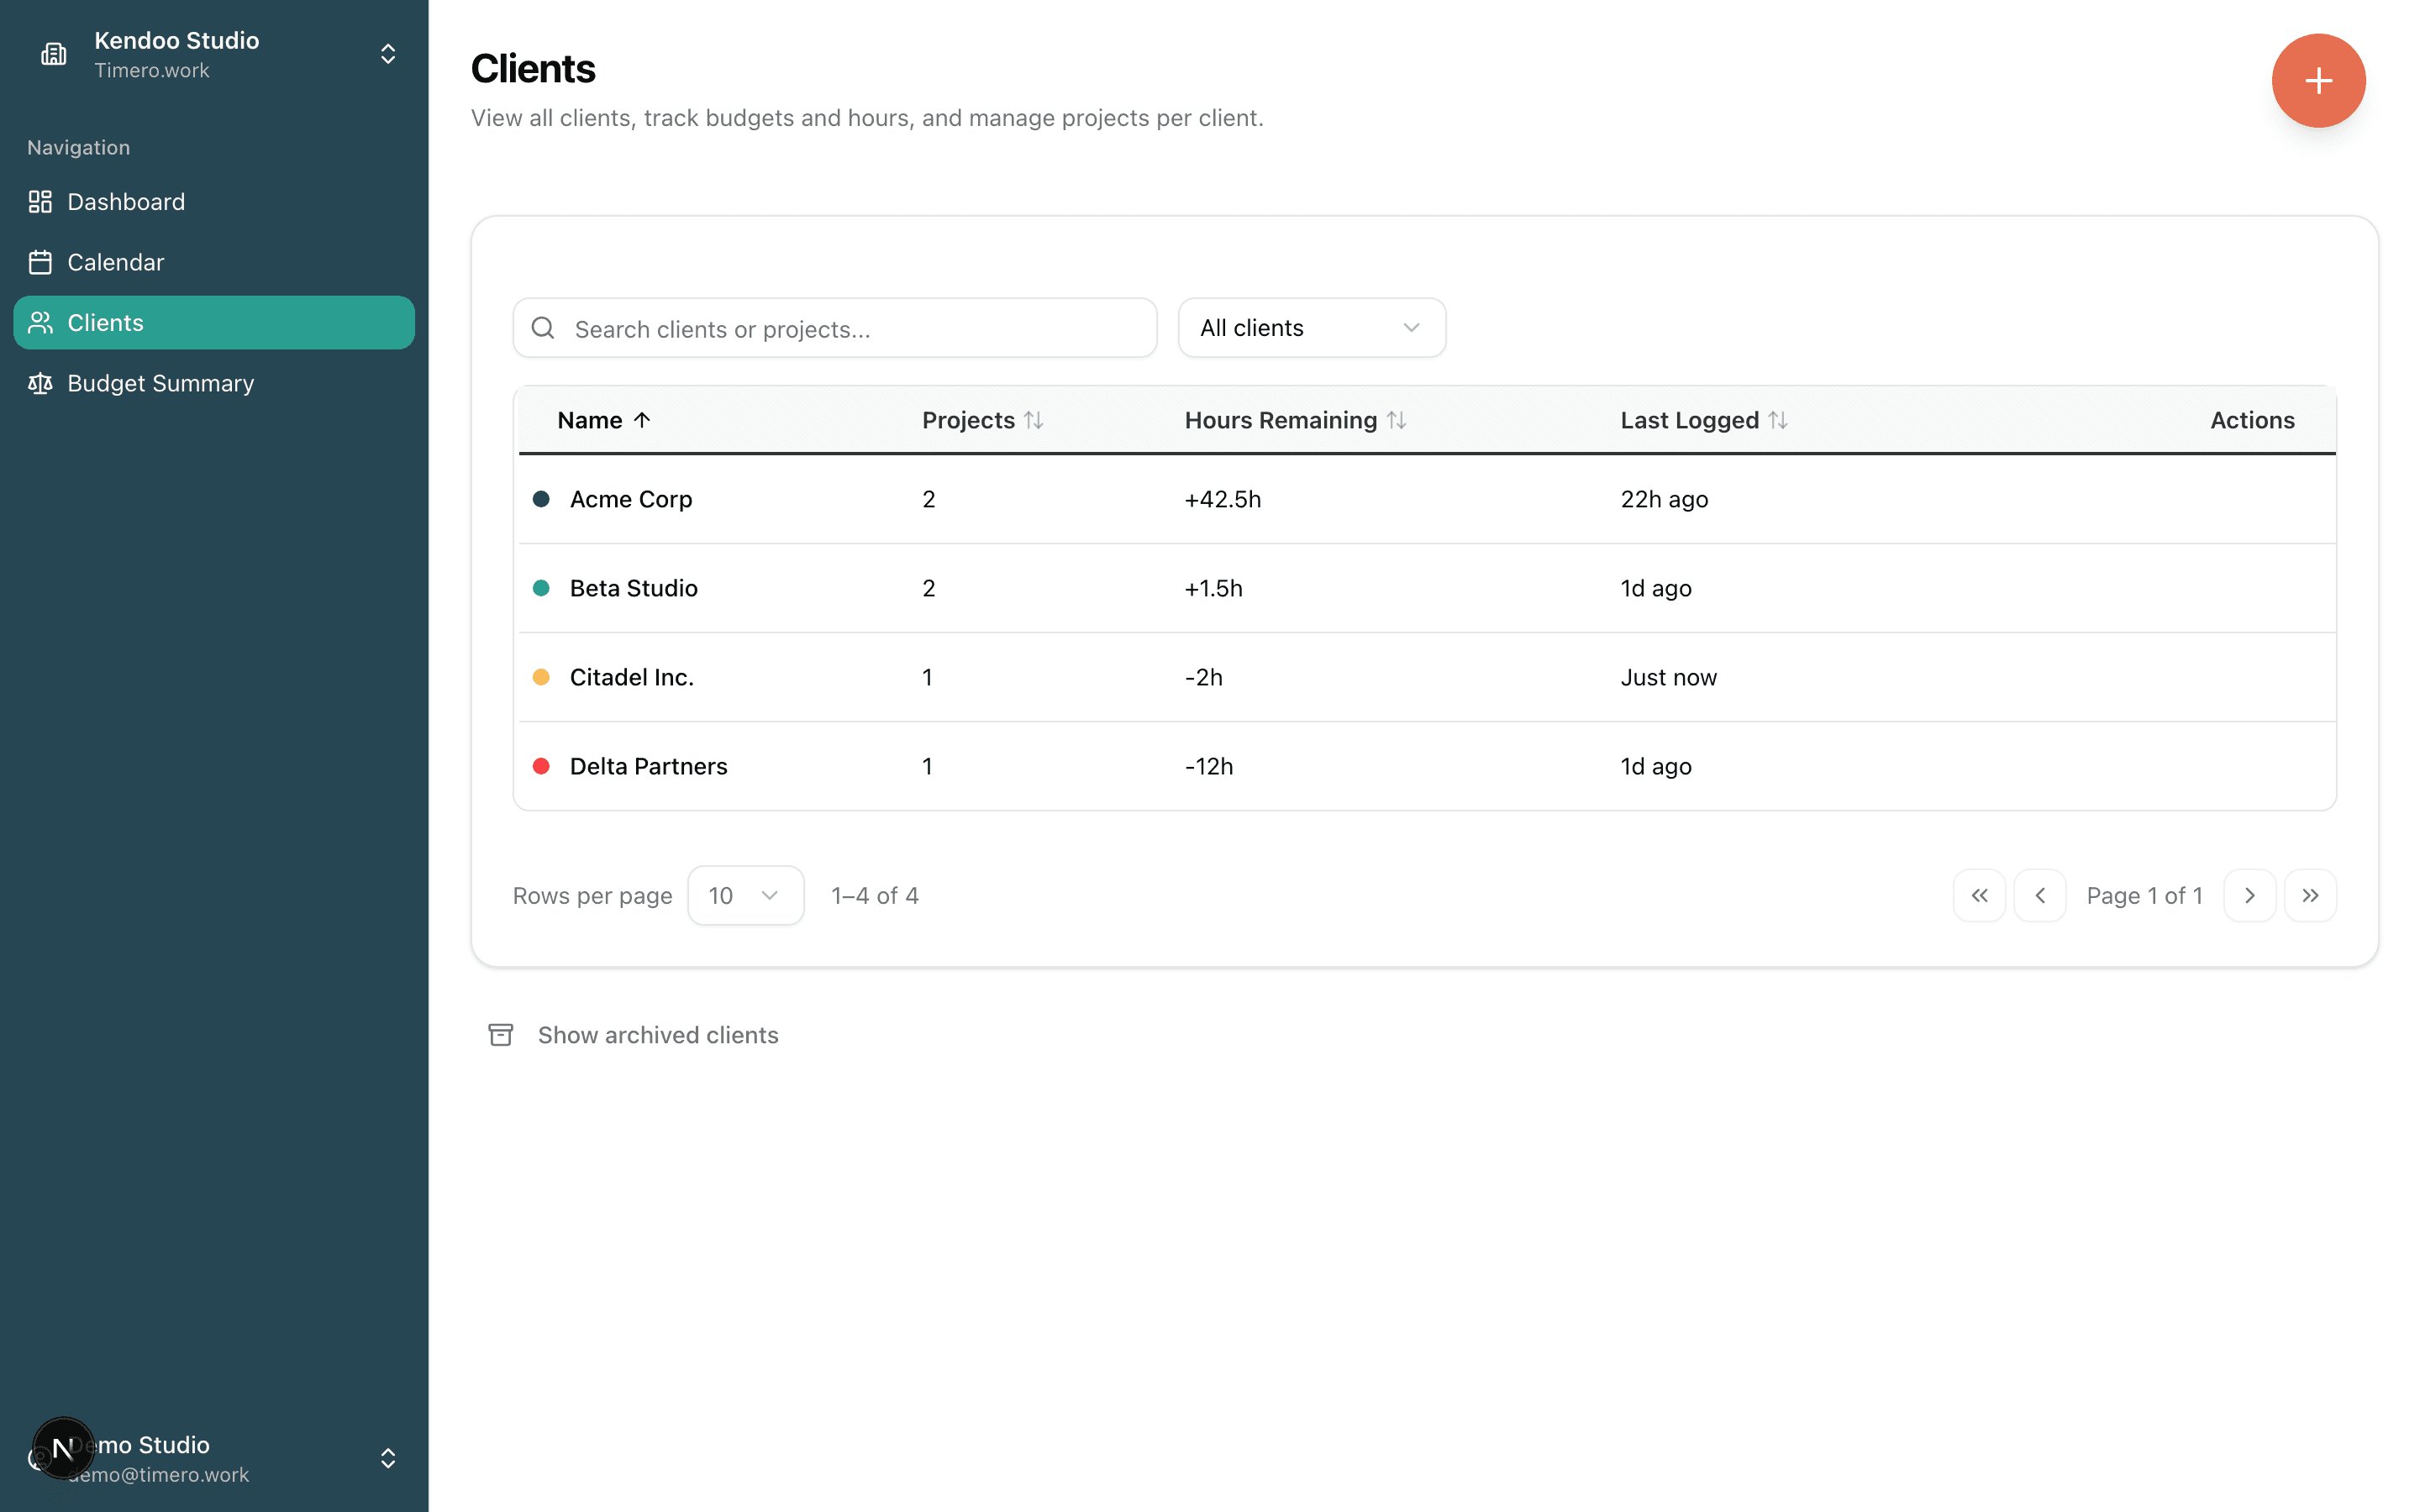
A clean table of every client, with hours remaining, project count, and last logged time. Color-coded by client. Searchable. Sortable. One click into the detail.
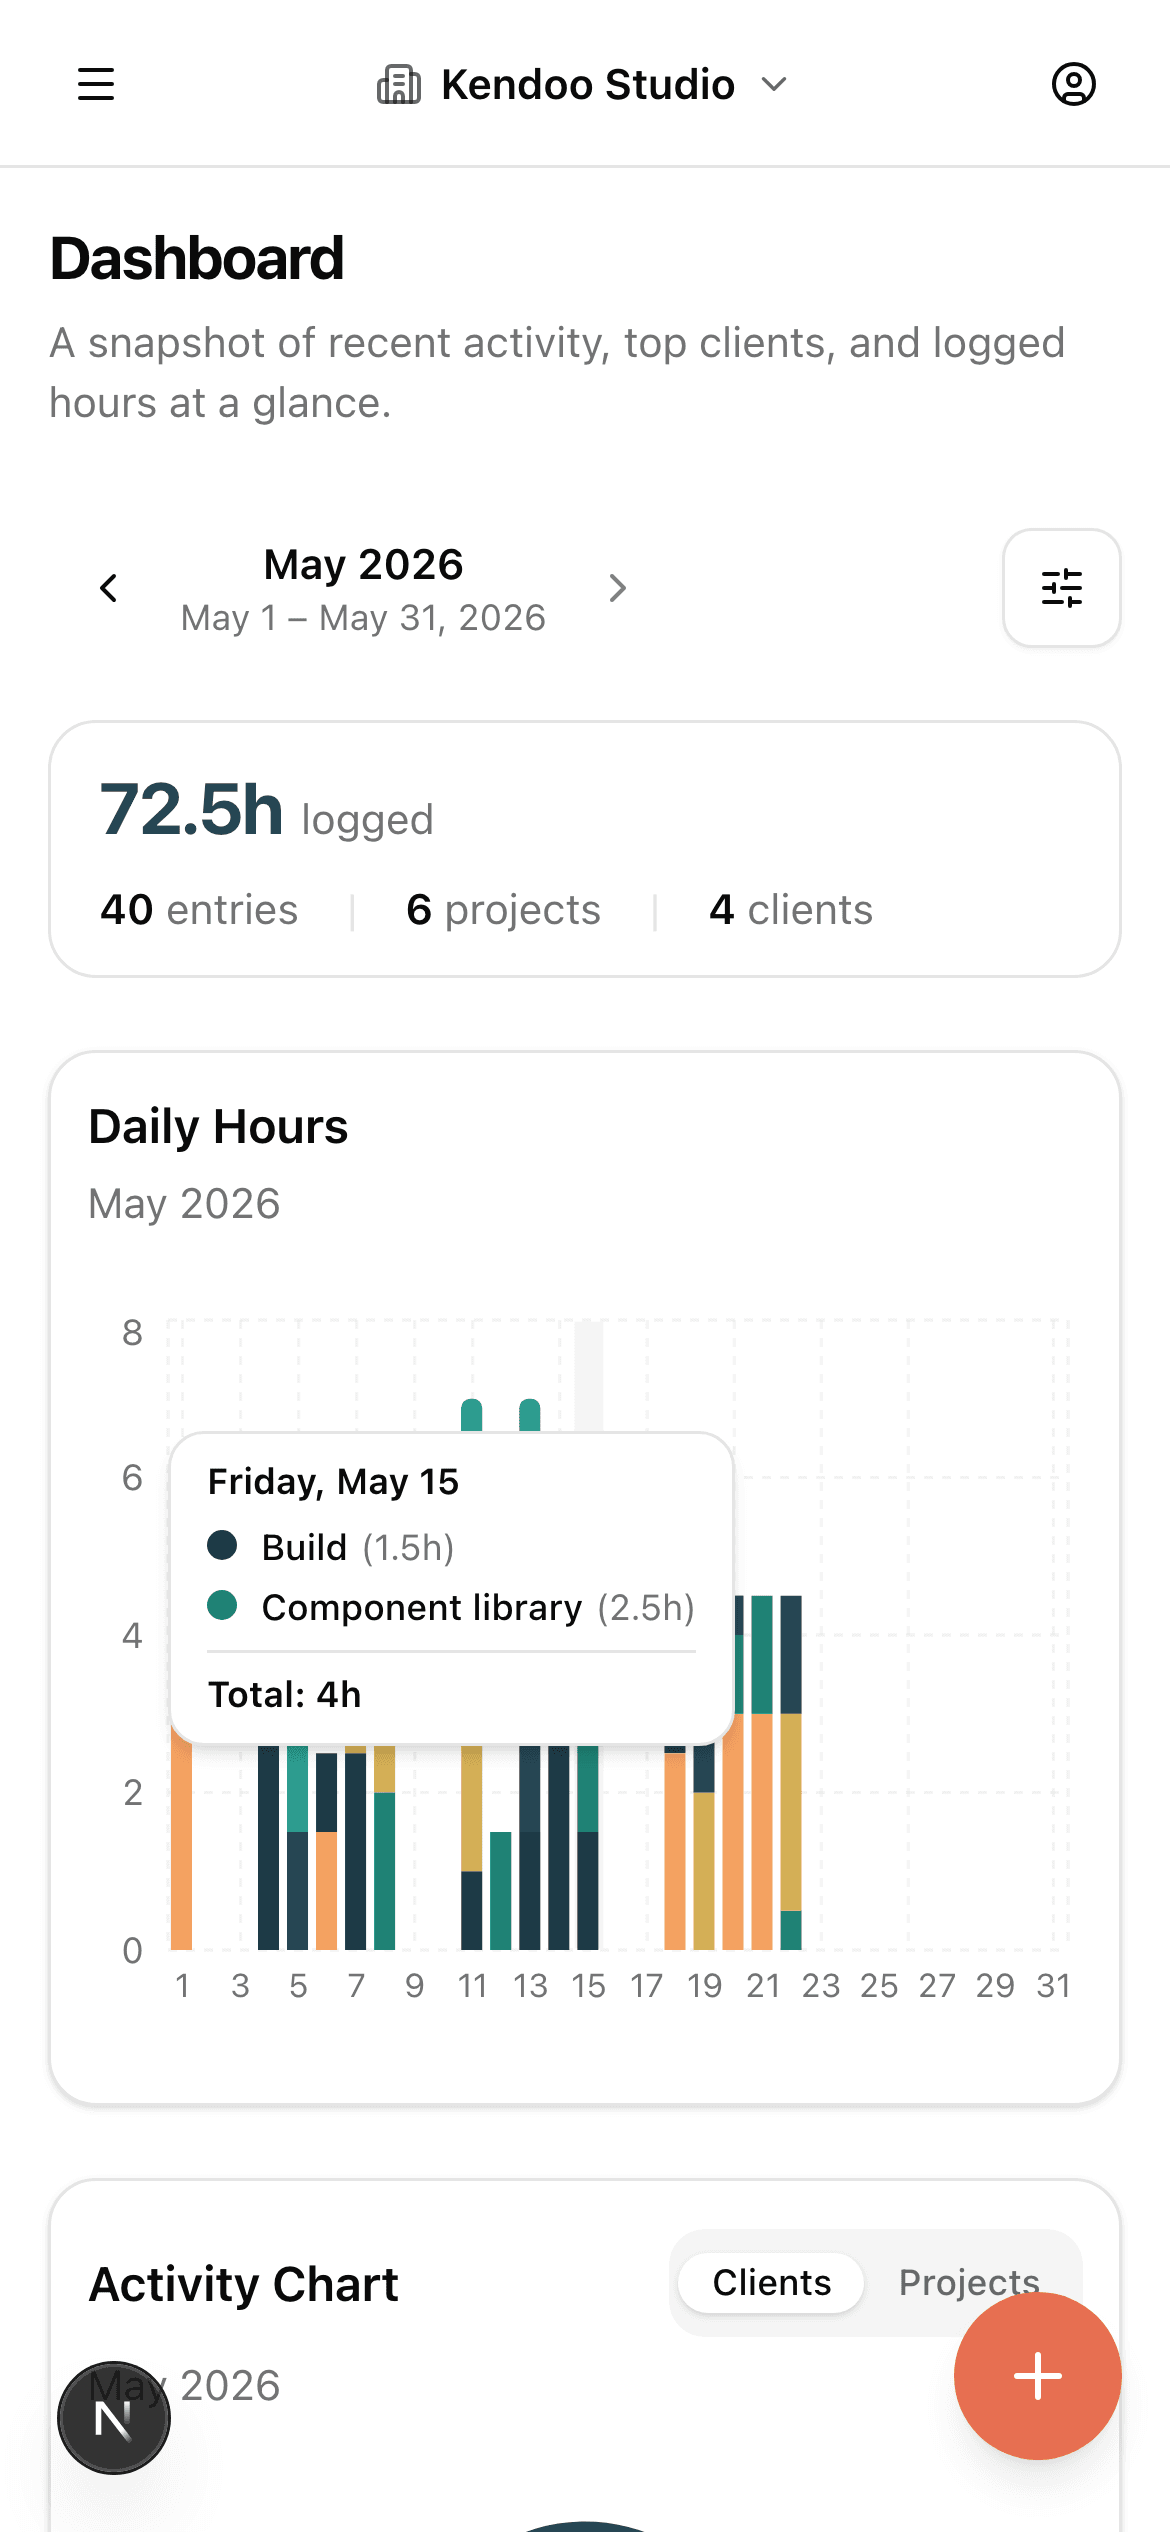
The mobile view is the same product, sized for your hand. Drag to log time, tap entries to edit, see your daily hours chart the way you do on desktop. The Google Calendar layer is there too.
Both PDFs below were generated from the app and captured as-is. The first is an hours-log summary report from /reports. The second is a per-budget consumption report from a client's budget detail page.
A clean monthly summary. Filter by client, project, or member before exporting. One click from the Reports page.
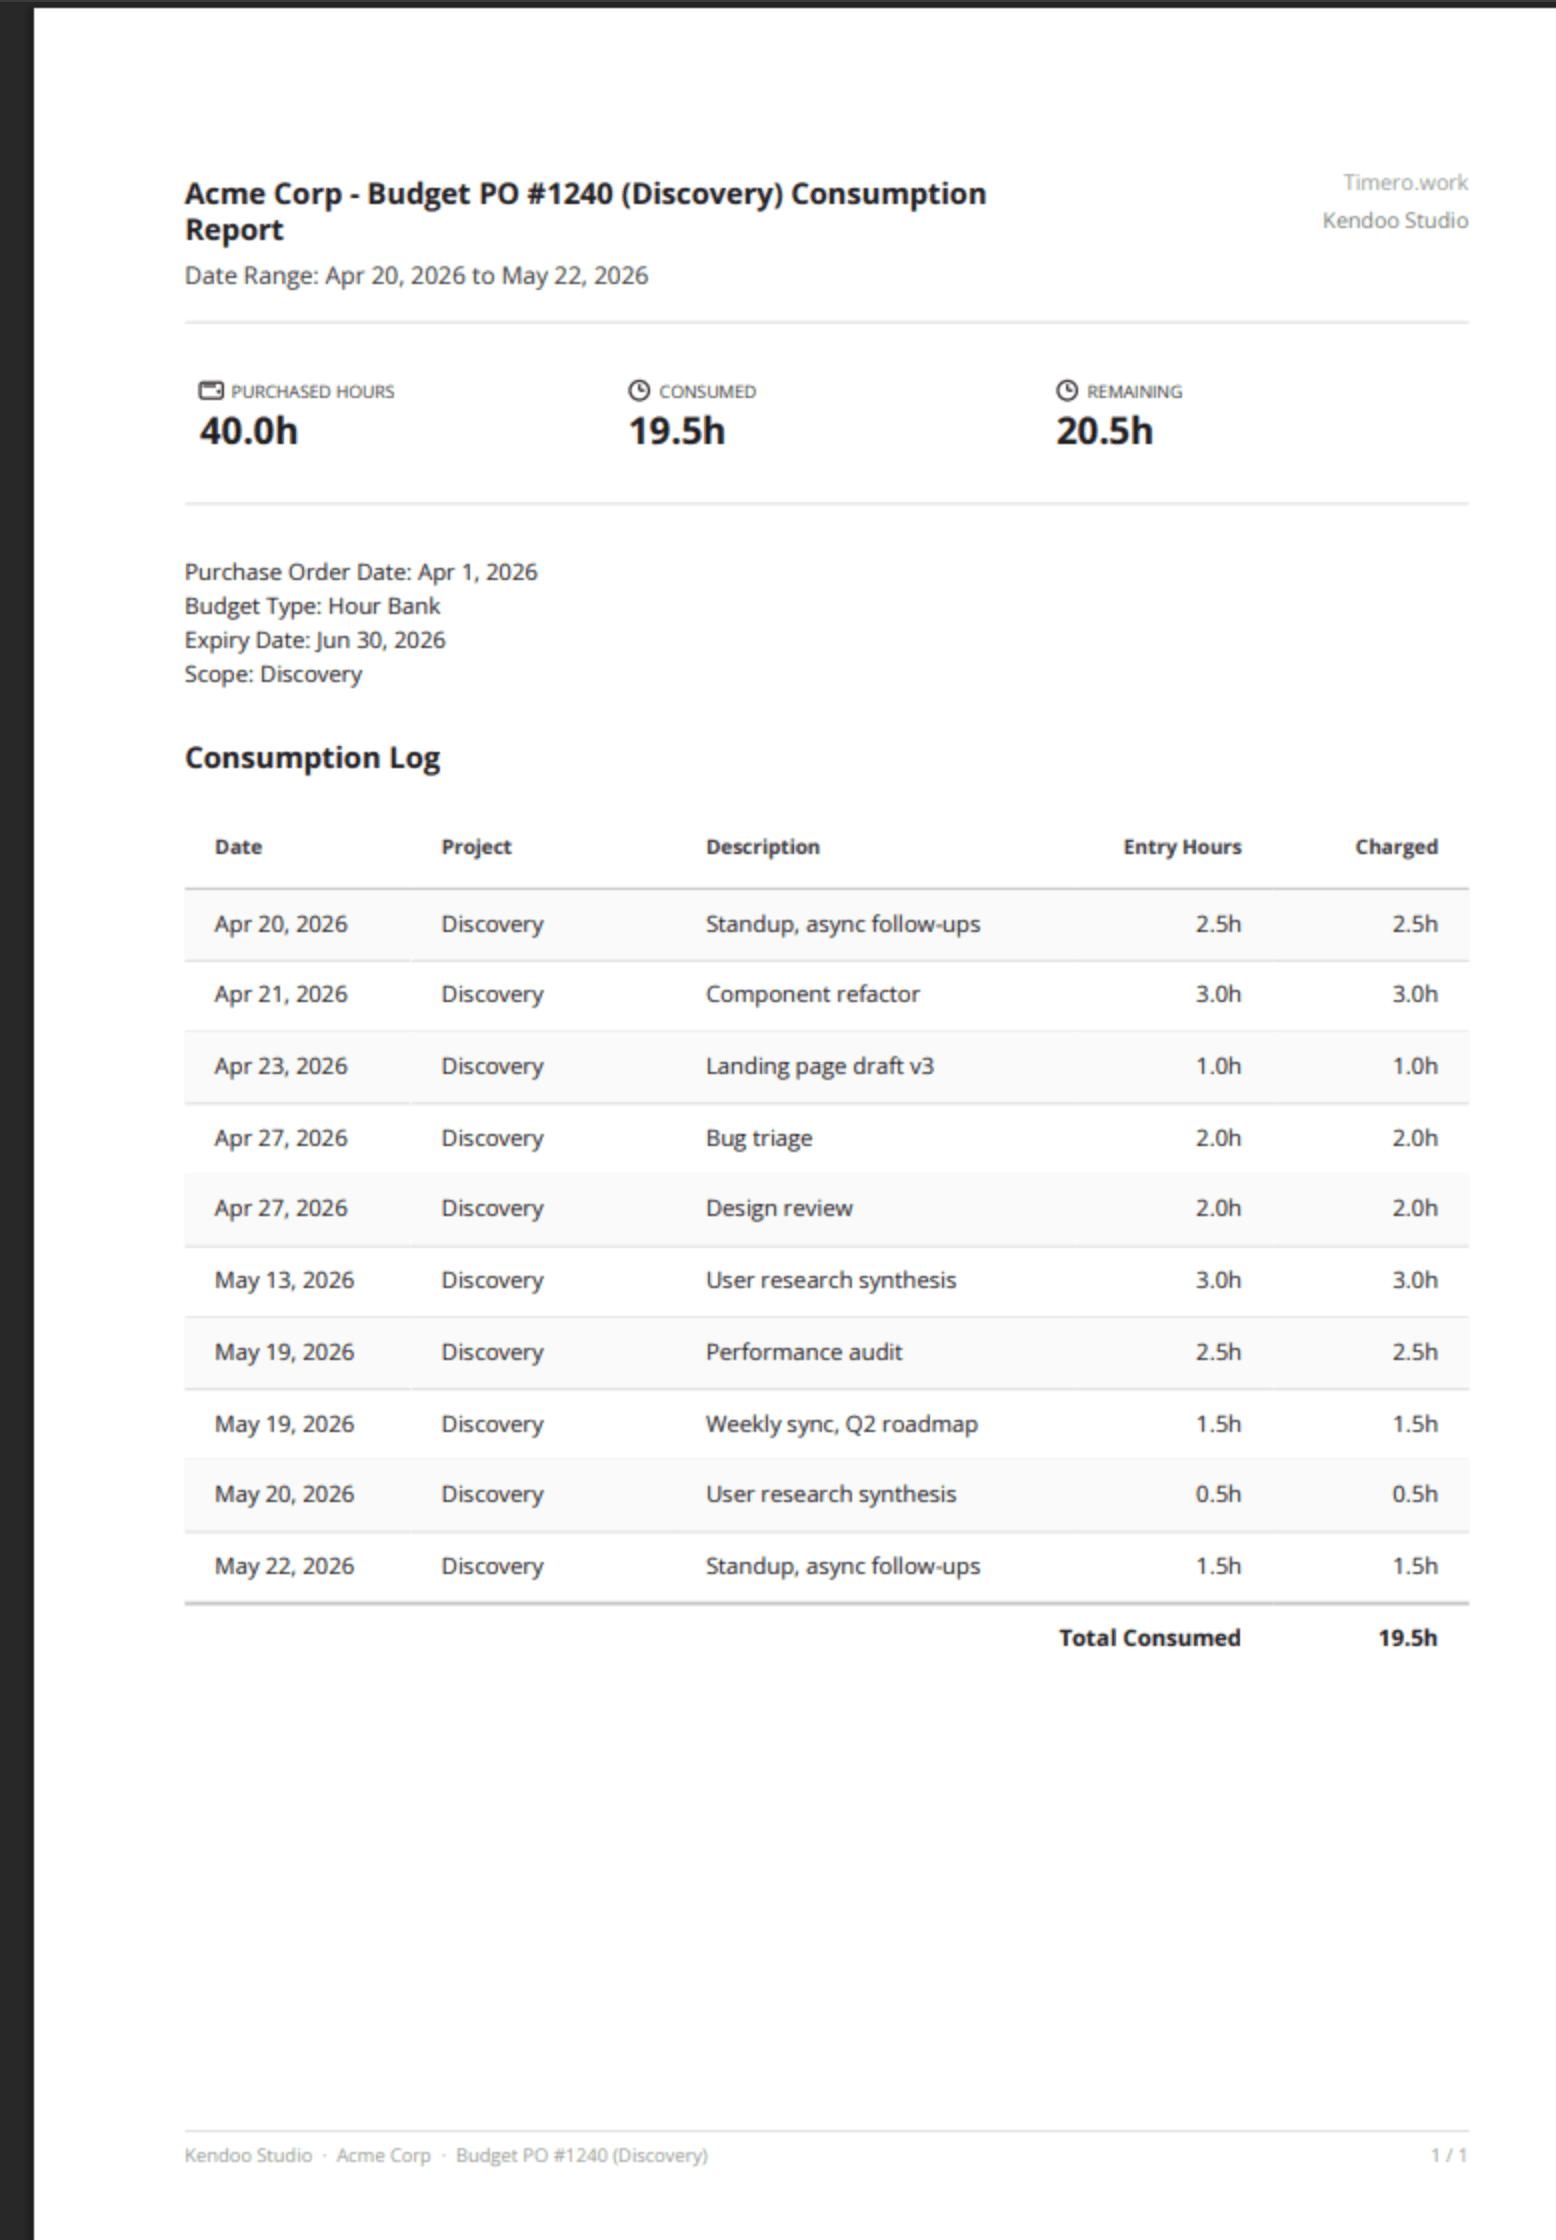
Purchased, consumed, and remaining hours at the top. Below: every entry that consumed this budget, in chronological order.
Start your 14-day free trial. Cancel anytime. EU-hosted.